Category Archives: General Use
Can LCQuan and TraceFinder Co-exist
In a word, Yes.
Well, to be a little more detailed. TF 2.0 and above can be installed on the same PC, but they have to be versions that are supported by the same Thermo Foundation base application. So LCQuan 2.7 is the needed version, today.
If you have the QuickCalc application, you can export the method out to a .pmd file then import into TF.
That export though does reset the retention time to 1.0 minutes so they will have to be reset in TF or you can reset the RT in Xcalibur.
You can also export the Sequence to a .sld file that can be imported into TF, if you want to look your already acquired data in TF for comparison.
Then you can simply right click in the Batch View Grid, browse to the data and and map raw files to samples. This will copy the files into the Tf directory and set the file references.
Then just submit the batch for Processing.
If you want to use a report much like the Long and Short Summary, use the TF Custom Report: Xcalibur Style Summary Report, that is located not he Custom Reports Template page.
Converting From Old to New… Methods, Data and Templates
TraceFinder provides an executable application the top level menu “Go” item, that will allow you to convert all of your old stuff to the latest versions of TraceFinder for use.
This includes all previous versions of TraceFinder and back to the LabForms 2.5.x application.
This allows you to reproduce your data and methods you currently use in the newer platform without having to recreate everything.
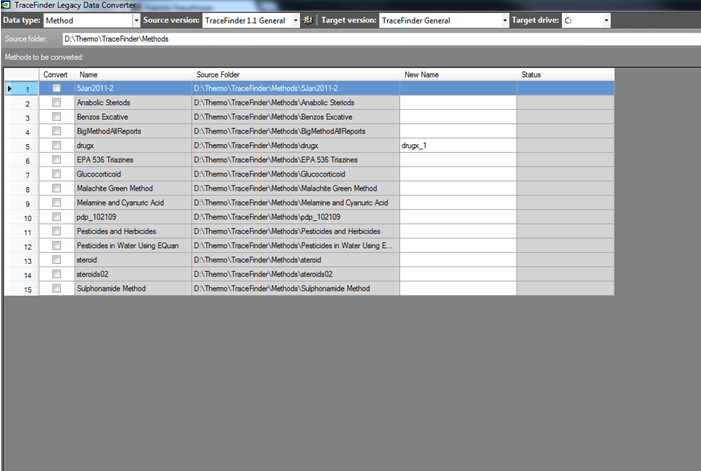
It also allows you to browse to any stored TF or LabForms directories to pull in the information even if, it has been archived on a remote disk.
After you have opened the directory the contents for the selected data type will be listed below.
You can select individual files or right click and select all. the simply press the “Start Converting” button in the lower right corner.
If any issues occur the Status column will contain an entry and the log file will record the issues with conversion.
A Quick Note on OneNote and Report Printing?
Is Microsoft OneNote hijacking your print jobs?
While we don’t usually focus on tech support issues here on the Office Blog (that’s what the Microsoft Answers forums are for), let me shine a quick light on a recurring issue that has caused some of you to scratch your heads and write in about.
In a nutshell, the problem appears to be that OneNote 2010 (or OneNote 2007) intercepts all of your print jobs whenever you try to send any information from your other programs or your Web browser to your trusty printer. While you must admit that this is a great way to save paper and finally “go green,” it’s no laughing matter when your boss expects you to hand him or her a printed report and you can’t seem to do that.
What’s happening?
Until recently, you’ve always been able to print anything from your computer to your printer. Now, your print jobs seem to suddenly bypass your printer completely and go straight into Microsoft OneNote, where they appear like scanned images. You really want things to go back to the way things were and have your print jobs sent to your actual printer once again.
What’s causing it?
Microsoft OneNote comes with a nifty little utility called the Send to OneNote print driver. A print driver is a small piece of software that directs output from a computer to a printer. Typically, the operating system controls such software, so it can monitor how a computer talks to hardware devices like a printer. In the case of OneNote, a special print driver is installed that lets you send your print jobs as images into your OneNote notebooks.
The OneNote print driver wasn’t designed to override your printer settings and assume you want every print job sent to OneNote 2010. Instead, it’s intended to be waiting in the wings, available whenever you want to use it, and taking a backseat again whenever you’re done sending a particular print job to OneNote.
However, the OneNote print driver may have accidentally promoted itself to top dog in any of the following conditions:
- You installed OneNote 2010 or Office 2010 with no physical printer installed or selected at the time, causing the Send to OneNote print driver to act as your default (preferred) printer.
- You installed a new physical printer on your computer after installing OneNote 2010 or Office 2010, without promoting the printer to act as your default printer.
- You share your computer with someone else who installed OneNote 2010 or Office 2010 and set the Send to OneNote print driver to act as the default printer.
- Your printer software is incompatible with your operating system version and Windows has reverted to the Send to OneNote print driver as the default printer.
Even if you’re not really sure how it may have happened, there’s an easy solution.

When the Send to OneNote 2010 print driver is marked as shown, print jobs will be sent to OneNote as images.
If you have a real printer installed, right-click its icon, and then click Set as Default Printer on the shortcut menu.
Your printer is recognized as the preferred printer for future print jobs when it has the check mark icon next to it.
How can I fix it?
On any edition of Windows 7, do the following:
- On the Windows taskbar, click the Start button.
- On the right side of the Start menu, click Control Panel.
- When Control Panel opens, click View Devices and Printers (if you’re in Category view) or click Devices and Printers (if you’re in Icon view).
- Right-click the printer icon that represents your physical printer, and then click Set as Default Printer on the shortcut menu.
If you’re using Windows Vista, the steps are nearly identical:
- On the Windows taskbar, click the Start button.
- On the right side of the Start menu, click Control Panel.
- When Control Panel opens, click Printer (if you’re in Category view) or click Printers (if you’re in Classic view).
- Right-click the printer icon that represents your physical printer, and then click Set as Default Printer on the shortcut menu.
If you do not see an icon for your actual printer, it’s likely that your printer is not correctly installed. Check the printer manufacturer’s website for any updated drivers that are specific to your version of Windows (for example, a 64-bit edition of Windows) and make sure that the printer is properly connected to your computer.
Don’t be hatin’!
Even if you had a bad first impression of the OneNote print driver hogging all of your print jobs, don’t be too quick to dismiss it even after you demote it from being your default “printer.” You might be surprised how useful it is to have the ability to print certain information right into OneNote.
Although digital printouts in OneNote are image files that you can’t edit, you can right-click such images in OneNote 2010 and extract the text from them with the Copy Text from Picture command. As long as the text in the image is large enough and legible, this works really well. You can then paste and use the copied text into your notes or elsewhere in your work.
When you’re properly introduced to it, the OneNote print driver is a pretty cool feature! 😉
Remember, whenever you have a technical support issue, head on over to Microsoft Answers — the official Support forums for OneNote and Office. It is monitored daily by knowledgeable and helpful members of the Microsoft MVP community, Microsoft Support, and the Office product teams.
— Michael C. Oldenburg
Multiplexing… The old and the new.
TF can be used with Aria MX and AriaOS.
Linked below is a guide on how to work with Aria OS and TraceFinder.
This allows the user to make use of his Aria OS system that has been certified for chemical analysis, but would want to take advantage of the superior TF quantitative properties. This relies on the fact that analysis is performed in a batch processing manner.
Sample List???…. Do I need a Sample List??? Yes and here’s how to import one
So the basic element of data navigation and collection is a list of samples.
This list will identify the properties of the data collected and tell the system, what to do to and the names of the files collected or to be collected.
So TF has a couple of different ways to do this.
The first and easiest is to make a template of the defined sample grid you want to use. In TraceFinder, the user can define the columns that are displayed in both the data results and sample definition grids.
In Batch View or in the sample page of the Acquisition Mode/Wizard, right click the mouse in the grid and a menu dialog that opens up.
In that dialog , select “Export to CSV”. This will make a copy of the grid and the header lables is a file that can be opened by any editing grid application. The most common is Excel, but you could open in a text editor also.
Simply, open the file and for daily use just input sample information in the template and save as a daily/batch .csv file.
A LIMS system, can create a .csv file in this same format or even use a bar code reader to fill in certain fields even in Excel.
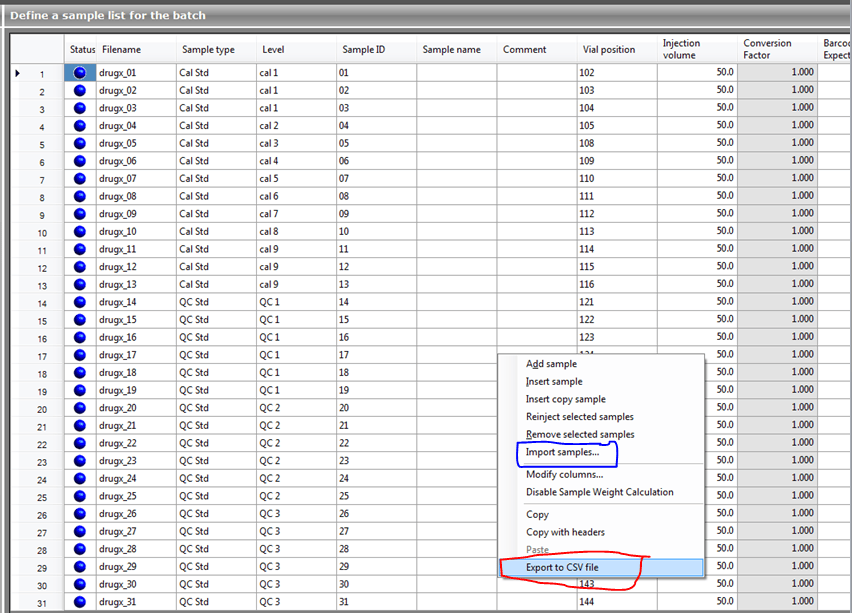
Once the sample input is done save the file as .csv and close the editor.
If the file is still open in Excel, MS Office will not let it be used by another program so TF can’t import it until it’s closed.
Right click in the grid and select “Import Samples”.
The Dialog below opens, then select the appropriate file.
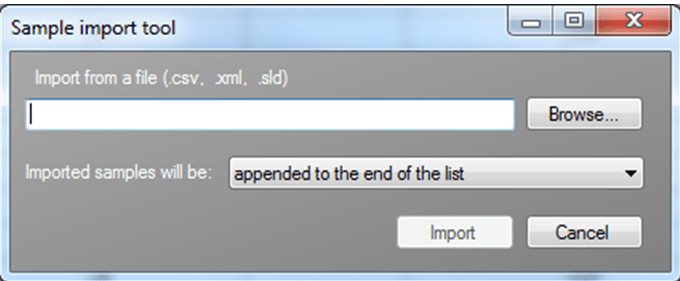
The information contained in the CSV file will be inserted into the grid either at the end of the current data or where the index indicator is if that is the option selected in the drop down list below the browse section.
There is also a xml format that can be created fromat LIMS system that can be used, or if Xcalibur has previously been in use the .sld files can be utilized also. Any sample type that TF does not recognize will be set to the Unknown Sample type.
Enable/Disable Ion Ratio
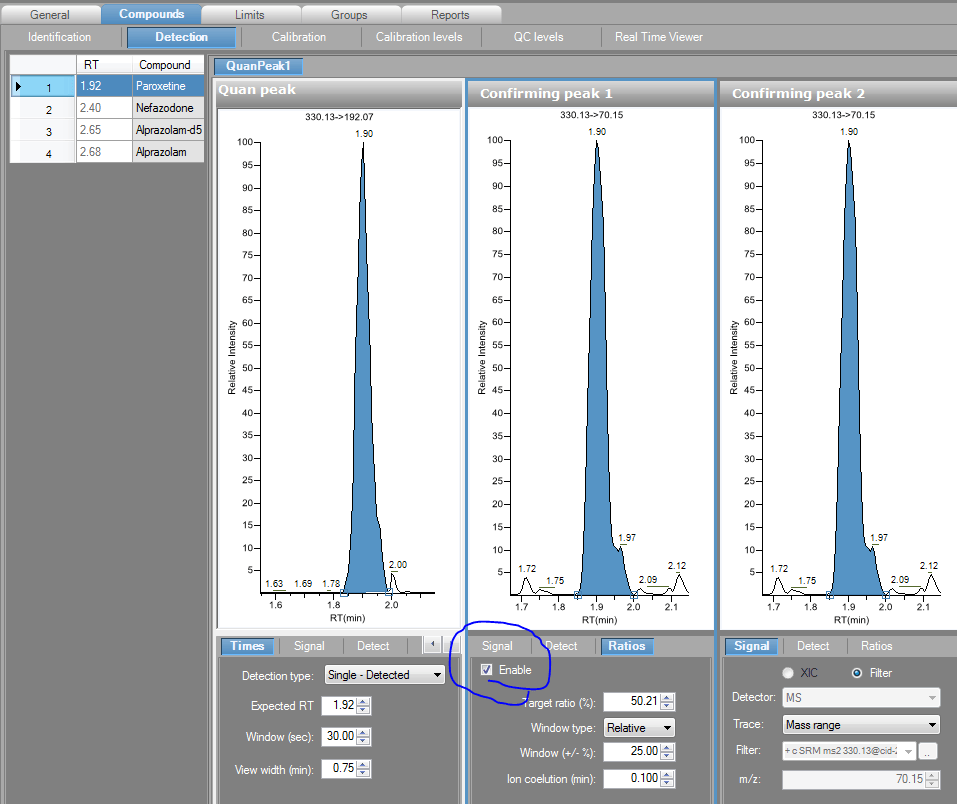
In TF Methods Ion Ratios can be set but updated not to calculate if needed.
In this case the user may find that they have set up a sort of generic method with two confirming ions.
The body they are doing the work for requires only one as part of their data set.
The user can simply go to the method and select an ion and disable the calcualtion by unchecking the “Enable” box on the ratios page.
The ratio wont be calcualted and the chromatogram will not be displayed in data review or on reports.
Ion Ratios – Where are they Displayed
One question that has come up recently is “where are my measured ratios displayed?”
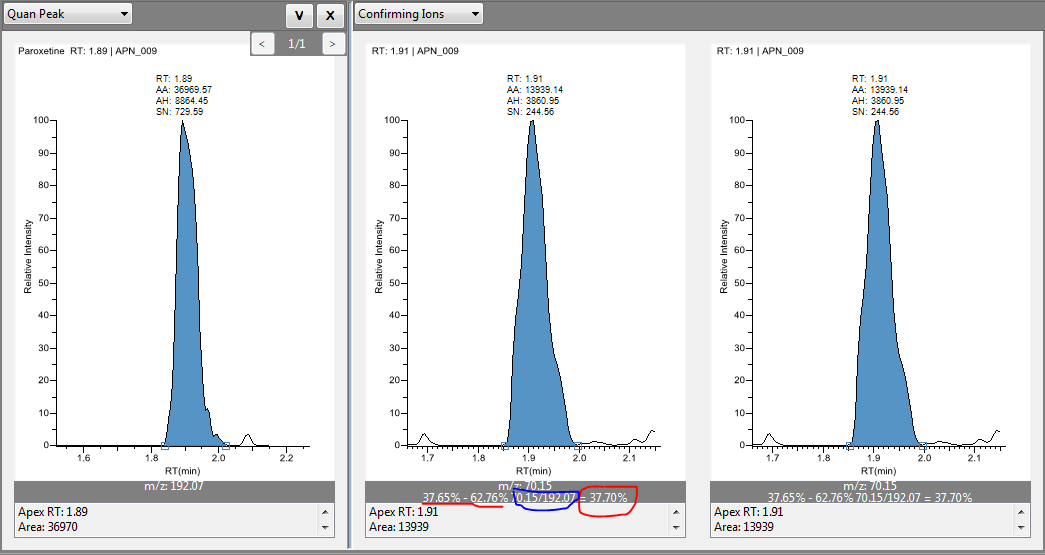
Well, Once you’ve processed your data, in Data Review of Analysis you can select a tab or display window to see Ion Ratios.
Below you can see the range of the accepted Ion Ratios as defined in the method, underlined in Red.
The Definition of what ion is measured, Underlined in Blue.
Finally, the actual measured ratio is circled in Red. If this value had fallen outside of the acceptable range then the peak itself would have a Red border around it.
The Sum of All Peaks
One of the key features of TF is the use of a compound being composed of multiple components.
So the gist, of it is that a specified compound can consist of up to 6 quantitative peaks, each of those can have up to 10 confirming ion ratio peaks.
So A compound can consist of up to 66 chromatographic peaks when using mass spectral data.
This means that you can visualize under the compound name quantitative peaks and their associated ion ratio confirming ions.
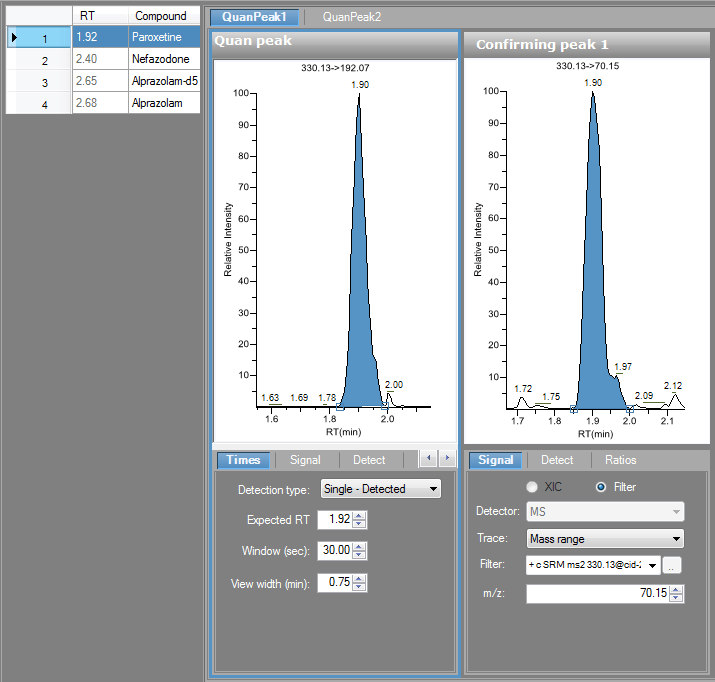
The compound is composed of these multiple peaks, which have summed areas. But they can be visualized separately. The total response of adding all the, lets say peak areas, is the total response of the compound. And by using the multiple quan peak feature, these chromatographic peaks don’t have to be at the same retention time. So if you were doing a chiral separation but wanted the total response, you would just make them individual quan peaks under the compound.
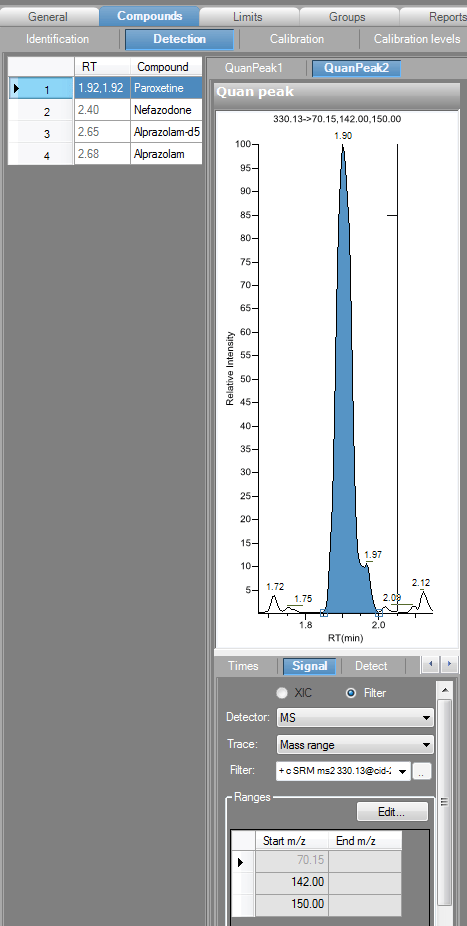
Now if you have coeluting peaks and want one big peak to represent your compound, then you can use the signal pane’s mass grid to accomplich this type of mass intergration.
All the responses are summed, but no individual visualizations.
Two ways in but no way out…… Xcalibur and TF open at the same time
HMMMMM…. Why am I golden but not green.. on my status ball.
All computer systems in the world, from a Operating System to specific applications like TraceFinder have a file managing system. Typically called an I/O or File I/O, for In and Out. This manages the handling of a file and the opening and closing of a file to extract data or other things inside the file.
Inherently TF and Xcalibur being from the same family of applications, act like siblings and try to grab the same file if they are both open at the same time.
If this happens then sometimes the door handle flies off and someone gets stuck inside.
When this occurs then rawfile will apprear as yellow status meaning it is acquired but not processed.
To fix this you just have to make sure xcalibur is shut down. and then proces the file. If for some reason that doesn’t work then you may have to reboot the PC. Not the best of situations, to say the least.
So Word To The Wise. Only use one Application at a time when Acquiring Data.
What the Heck is a Ion Range????????
So one thing that has been resurfacing is confirmations that I know what think is my data really is my data.
TF uses one such tool in Ion Ratio calcualtions.
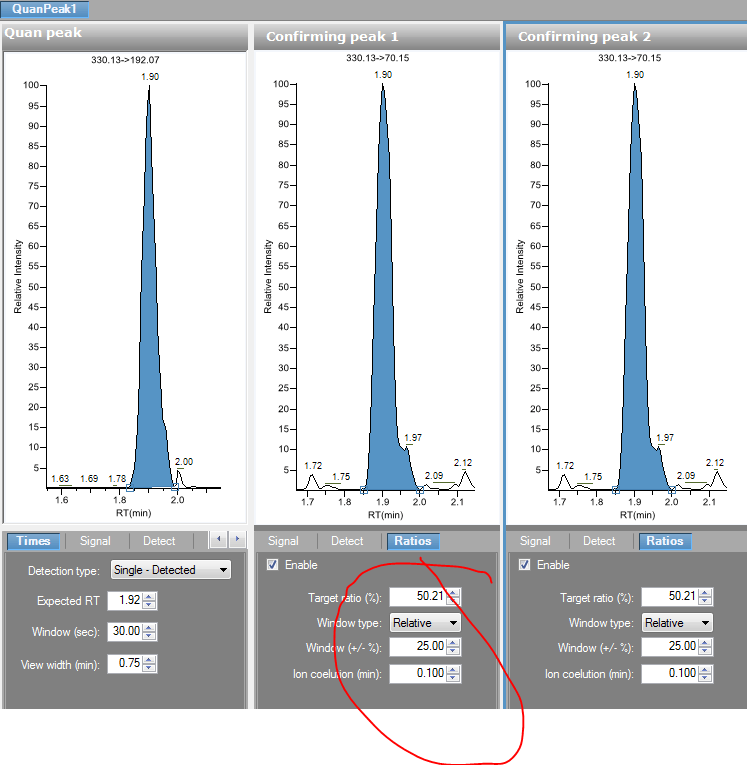
This is a ratio of the selected response of one defined peak that is connected to another defined peak.
In TF, we define that as, a Confirming Ion has a Ratio to the Quan ION/Peak, and we can set some acceptance threshold around that ratio.
Now, we have a few ways of defining the Ratio.
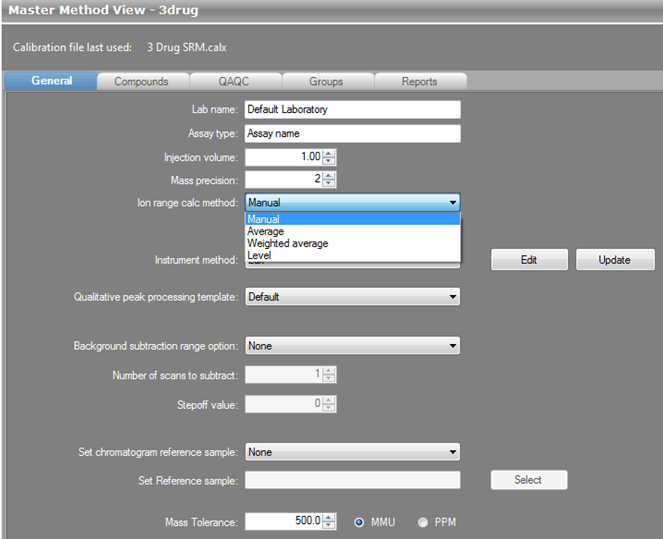
Thats the Ion Range.
Now we can use:
Manual – Where you type in the Target Ratio.
Average – Where the Ratio is deteremined by Averaging the ratios found in the calibration curve for these peaks and then producing an average. This automatically sets the Target Ratio, so you don’t have to.
Weighted Average – The same as above but its weighted and usually used for really large orders of magnitude methods.
Level – Again its like the above but it only finds the Ratio for the one specified calibration level.
The last three allows the data to define your criteria, and keeps you from having to adjust the ratios manually. This can be done for processing on the fly or in post acquisition processing.
