Category Archives: Ask a guru answer
Associating another batch’s Calibration Curve to the current batch – (Answer to a “Ask A Guru” Question)
I think that the questions below are pretty self explanitory of the feature in the video.
“What would you like to know?: Hi, Jamie,
Example: A Cal curve batch is acquiring.
Case 1: I submit a new batch of just patient samples and forget to extend the cal file to those samples. How do I extend the cal file to those samples w/o pulling them into the Cal Curve batch?
Case 2: I submit a new batch of just patient samples and extend the cal (with the wrong file) to those samples. How do I reprocess with the correct cal file?
Company: TFS
Area Of work: Clinical”
So if you have a batch in flight. You should pause the acquisition while you associate a calibration file. It just makes things cleaner if you have an older system with less RAM.
The video is out of the soon to be released TF 3.0, but if you are using and older version the functionality and menu selections are still the same. Dependant on the resolution setting the last frame may be overlayed with another.
If the video is blurry please click the cog wheel at the bottom of the panel and increase the video display resolution.
Custom Reports and How to request
So today I’m going to Blog about the Blog.
This last week, I’ve had several requests on custom reports. If you look on the tab pictured below you’ll see a form on the Blog, that gets sent directly to the TF team. We just need to make sure we get your contact info and someone will liason your request.
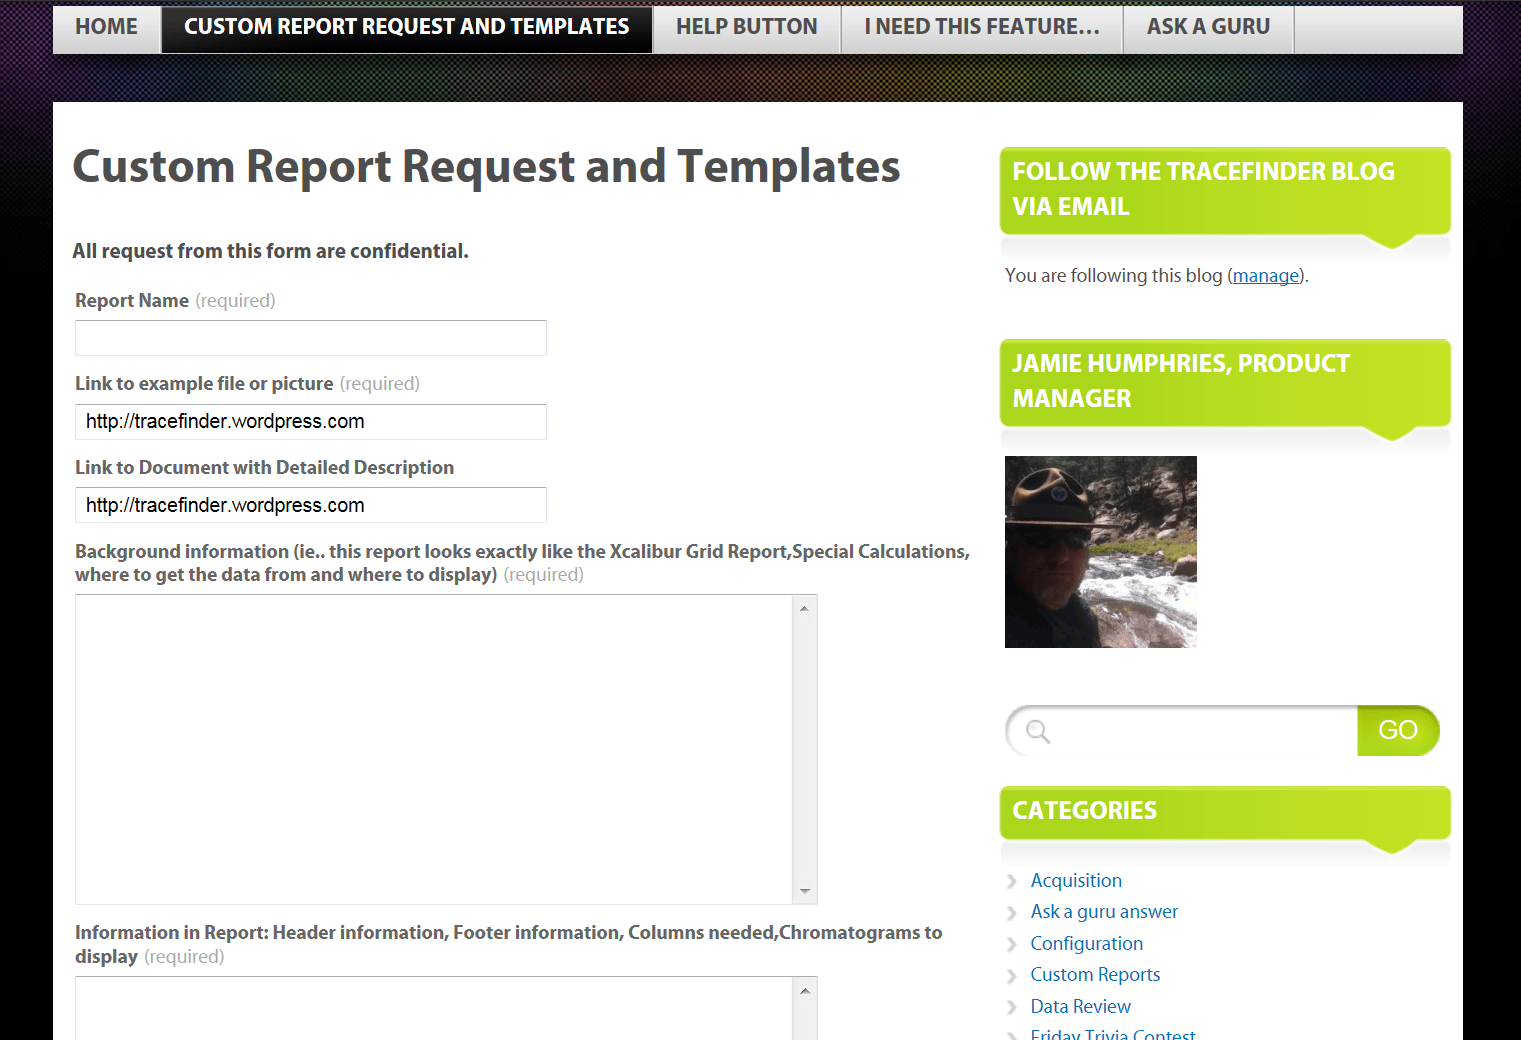
We provide a professional service, that is solely dedicated to creatin these Templates that can be imported directly into TF. With our data structure we can provide almost any style of report needed, within the Excel framework.
An example of the an intersting request, was a metabolism heat map of calculated concentrations, that displayed compounds as rows and sample/groups as columns and then applied conditional formation to color code the results.

All this was accomplished in a small amount of VBA, and turned around quickly.
So let us hear from you, and your ideas of how you’d like to see your data either in reports or in new views within the application.
Excel rules the world or at least it thinks it does…..
So, this week we’ve gotten a few questions on importing a sample list in CSV format.
There is an error that can occur if the csv file you exported and made adjustments to, is still open in Excel when you try to reimport it.
Unfortunately, the error message isn’t as descriptive as maybe it should have been, but it did give us a chance to post another answer to a “Ask A Guru” question
If the video is blurry please click the cog wheel at the bottom of the panel and increase the video display resolution.
What the Heck is ACTIVE VIEW??????(Answer to a “Ask A Guru” question)
Active View is another visualization of the data that is on a Sample Centric Report. These are only availible today on samples that display chromatograms for compounds and contain grouped sample information.
Sucha as the High Density Reports, in the standard reports section of Report View.
When using Report View we generate a temporary view of the report that would be produced by the system. This view is only for the supplied Standard reports delivered with TF and is not available with Custom Reports, today. (Hint be looking to the future.) 😉
But when the report is generated in preview mode, and it has an ActiveView partner, the Active View tab will appear next to it.
In the Active View tab, you will see a grid of data that corresponds with data on the Report and the same Detailed Editing elements in Data Review, with the same functionality.
When data is changed in Active View it is just like editing in Data Review and results are updated. When this happens and indicator appears to let you know new results are availible for the report. Once clisked the Report is updated. The information is saved. In this manner you can use Report View as your data editor and see exactly what you are giving your clients in real time. You can at this point choose to generate the report, or make all your edits and then generate the reports in a batch process.
If the video is blurry please click the cog wheel at the bottom of the panel and increase the video display resolution.
Need to just enter some compound info for the method… Ok here’s a solution
So at times we’ve had the request that chemist just want to enter in some compound data without having a rawfile to extract the spectra from.
And though TF gives you multiple ways of creating methods, some feel they just want to be able to add a compound and input their data by hand.
Though many workflows support doing this in using a CSV file and creating a method from importing that csv file into the CDS, sometimes that just may be too much.
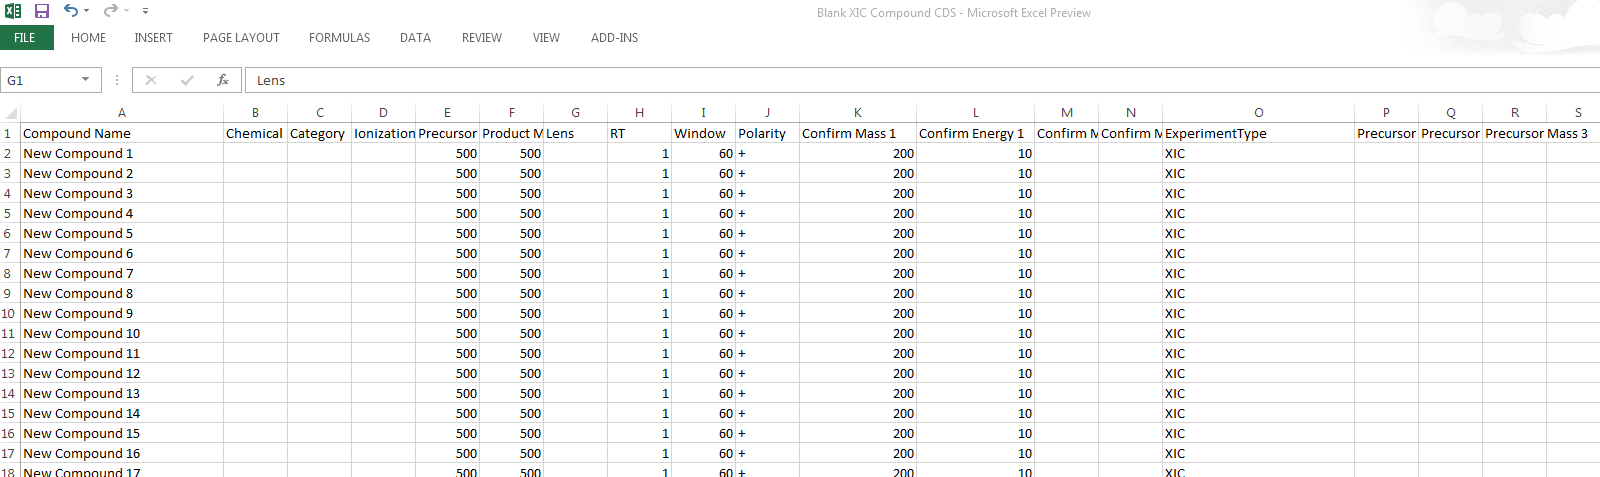
So here is couple of CDS files that you can have on hand just to pull over and fill in place holder information.
One is for XIC/SIM type of experiments and the other is for SRM type of experiments.
https://dl.dropbox.com/u/13860428/Blank%20XIC%20Compound%20CDS.csv
https://dl.dropbox.com/u/13860428/Blank%20SRM%20Compound%20CDS.csv
Making changes in to the multiple peaks in a compound (Answer to a “Ask A Guru” question)
There are times that a chemist may make a method from a PMD file or from CDS, and things need to be changed.
An istance would be swapping an existing quan peak with its confirming peak, or removing a confirming peak.
These changes while seemingly trivial can be a hassel if you have to do many of them. So the TF team has given these options as right click contect menus to make it easier to perfrom these functions.
Watch the video below to get an idea of how to use these tools.
If the video is blurry please click the cog wheel at the bottom of the panel and increase the video display resolution.
Matrix Spike and Matrix Spike Duplicate… Understanding the how it works.(Answer to a “Ask a Guru” question)
A question from the Ask a Guru was how to use MS/MSD samples and reports, well read below.
In the Environmental realm there is an experiment for a Matrix Spike and a duplicate, when compared to an unknown sample.
This allows for the chemist to calcualte a recovery of of the compounds contained in the unknown sample.
To set up the experiment the chemist needs three sample types.
- Matrix Spike – with compounds spiked into it at a known level
- Matrix Spike Duplicate – with compounds spiked into it at the same level as the Matrix Spike
- Unknown – a sample with unknown amounts
Under QAQC tab of the Master/Local Method the concetrations of the spikes compounds must be entered in the grid for the MS and MSD tab.
In the Batch View the samples to be grouped together and used to report the Recovery must have the same SAMPLE ID. There must be one of each SAMPLE TYPE, but each one must have the sample SAMPLE ID text in their individual grid cell.
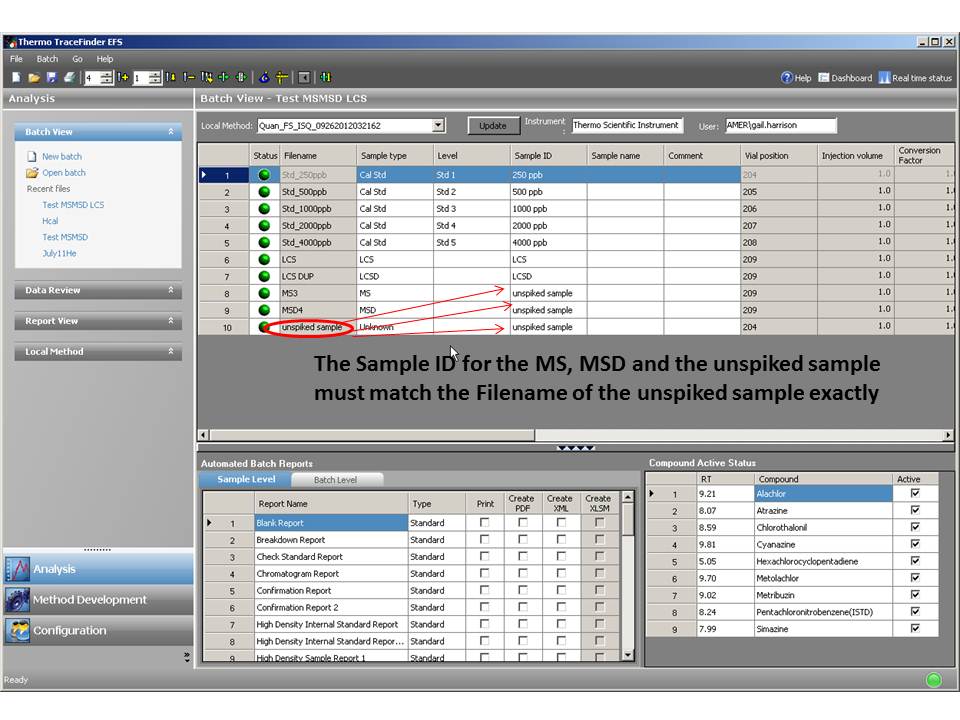
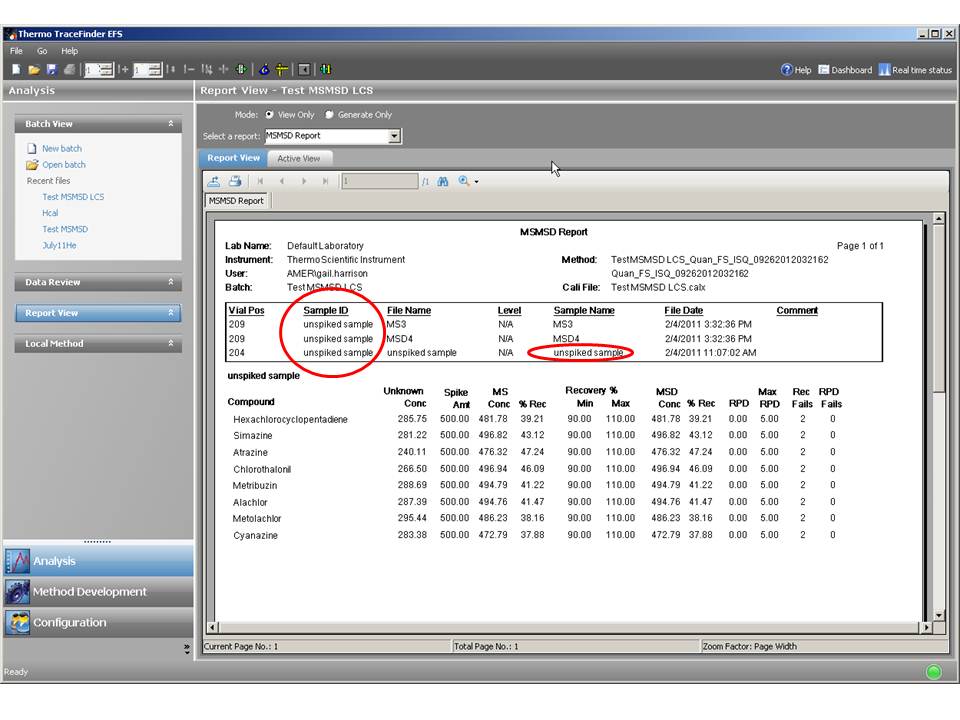
When the batch is processed the data for recovery will be calcuated and a MS/MSD Report can be generated that displays the information about this experiment.
See the picture below of the report in Report View.
Thanks to Gail Harrison for her suggestion on a blog post.
